Let's be honest, social media engagement metrics sound like dry, boring data points. But they're not. Think of them as the vital signs for the health of your online community. These numbers tell you if your content is actually connecting with people or just getting lost in the scroll.
Why Engagement Is More Than Just a Number

Before we get into formulas and benchmarks, we need to completely reframe what "engagement" means for your business. It’s not a vanity metric—it's the pulse of your community. For founders and consultants trying to build a real presence on LinkedIn, this distinction is everything.
A massive but silent audience is like a packed networking event where no one is talking. It looks impressive from the outside, but nothing is actually happening. A smaller, highly engaged group, however, is a focused workshop where deals are made and partnerships are formed. It’s no surprise that 65% of marketing leaders say they need to prove how social media helps the business to get leadership on board. Quality engagement is how you do it.
The Business Conference Analogy
Imagine your LinkedIn profile is a business conference, and you're the keynote speaker. Every post you publish is a presentation you're delivering on stage.
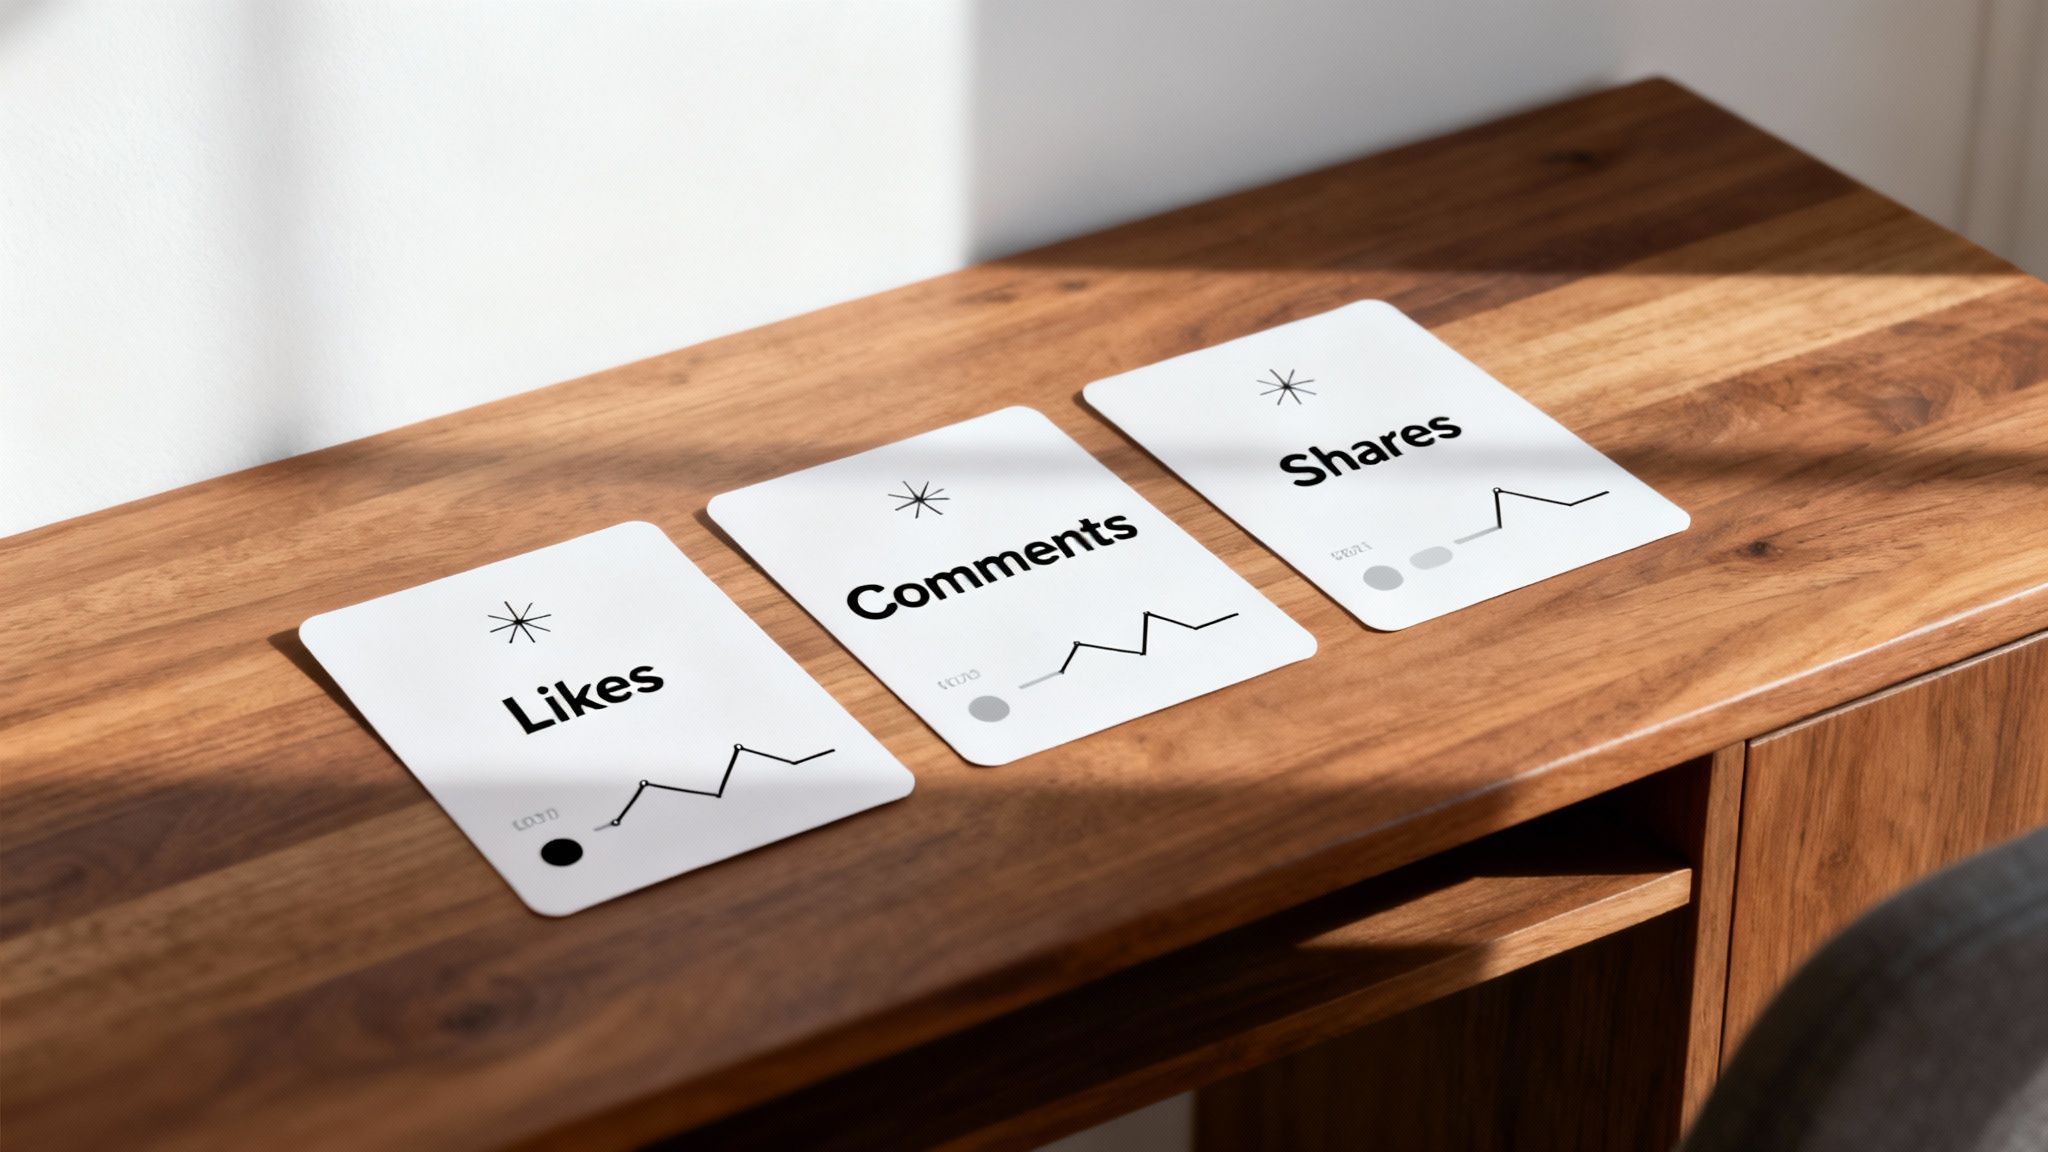
From this perspective, your social media engagement metrics become clear indicators of how your talk is landing:
- Likes are the polite nods from the audience. They signal that people are listening and appreciate what you're saying, but it’s a passive gesture.
- Comments are the Q&A session after your talk. This is where the real magic happens—people are raising their hands, asking questions, and starting conversations that build genuine relationships.
- Shares are when someone in your audience is so blown away they run out to the hallway, grab a colleague, and drag them in, saying, "You have to hear this." It’s the ultimate endorsement.
This isn't just about counting clicks anymore; it's about understanding the business impact behind each action. A single, insightful comment from a potential client is infinitely more valuable than a hundred mindless likes.
Engagement is the currency of trust. When your audience invests their time to comment or share, they're not just interacting with a post; they're endorsing your authority and extending your professional network.
From Broadcasting to Building Connections
At the end of the day, a professional platform like LinkedIn isn't for shouting into the void. It’s for building the real-world connections that lead to sustainable business growth. A huge follower count might feel good, but an active, responsive community is what actually generates leads, drives referrals, and solidifies your reputation.
When you start focusing on the quality of these interactions, you move beyond the numbers and start measuring what truly matters: the strength of the relationships you’re building with every single post. That's the foundation of a LinkedIn strategy that actually pays off.
Your Guide to Core Social Media Engagement Metrics
If you want to build a winning LinkedIn strategy, you have to learn to speak the language of its data. The platform gives you a ton of information, but those numbers are useless unless you know what story they're telling. This guide will pull back the curtain on the core social media engagement metrics, turning them from confusing figures into insights you can actually use.
Think of your LinkedIn Analytics as the cockpit of your professional brand. Each metric is a dial or a lever. Knowing which ones to watch and which ones to pull is how you steer your content toward real growth. Let's break down the essentials.
Foundational Interaction Metrics
These are the most obvious signals you get from your audience. They're the digital equivalent of a nod, a handshake, or someone repeating what you said to their friends.
Likes (or Reactions): This is the quickest form of feedback. On LinkedIn, you get options beyond a simple "Like"—you can choose "Celebrate," "Support," "Love," "Insightful," or "Funny." A basic "Like" is a low-effort tap, but a specific reaction like "Insightful" tells you your content hit a much deeper, more professional chord.
Comments: A comment isn't just an interaction; it's the start of a conversation. It means someone stopped scrolling, processed your idea, and felt compelled to add their own voice. High-quality comments that spark real discussion are pure gold for the LinkedIn algorithm.
Shares (or Reposts): This is the ultimate stamp of approval. When someone shares your post, they're vouching for your content in front of their entire network. It’s powerful word-of-mouth marketing that gets your ideas in front of fresh, relevant eyes.
These three metrics are the bedrock of engagement, but they don't give you the whole picture. For that, we need to look at how far your content is actually traveling.
Visibility and Discovery Metrics
While these aren't direct interactions, they're critical for understanding the sheer size and scope of your audience. They answer a simple but vital question: "How many people are actually seeing this stuff?"
Impressions
This is the total number of times your post was shown in someone's feed. It’s a raw count of views. So, if one person sees your post on their laptop and again on their phone, that's two impressions.
High impressions mean the algorithm is working in your favor and pushing your content out there. That’s a great start. But views alone don't equal impact. To dig deeper, check out our complete guide to understanding impressions on LinkedIn.
Reach
Reach is different. It measures the number of unique people who saw your post. In that last example, the person who saw your post twice counts as two impressions but only one for reach. This metric gives you a much clearer idea of your true audience size.
Think of it this way: Impressions are the total number of flyers handed out on a street corner. Reach is the number of individual people who actually took one.
Action and Intent Metrics
Okay, so people are seeing your content and giving it a thumbs-up. But are they taking the next step? These metrics show a much stronger level of interest and intent.
Clicks: This tracks how many times someone clicked on anything in your post—a link, an image, your company page, or even the "...see more" button. Clicks are a clear signal of curiosity, making them a crucial metric for any content designed to drive traffic.
Click-Through Rate (CTR): Clicks are great, but CTR tells you how effective your post was at getting those clicks. It's the percentage of people who clicked after seeing your post. A high CTR means your headline, image, and call to action were compelling.
Saves: When someone saves your post, they're bookmarking it for later. This is a huge compliment. It means your content is so valuable they see it as a resource worth returning to.
To make this even easier, here’s a quick-reference table for the metrics that matter most on LinkedIn.
Key LinkedIn Engagement Metrics and Their Formulas
| Metric | What It Measures | How to Calculate It |
|---|---|---|
| Engagement Rate | The percentage of your audience that actively interacted with your post. | (Likes + Comments + Shares) / Impressions x 100 |
| Click-Through Rate (CTR) | The percentage of viewers who clicked on a link in your post. | (Total Clicks / Total Impressions) x 100 |
| Impressions | The total number of times your post was displayed on a screen. | Provided directly by LinkedIn Analytics. |
| Reach | The number of unique people who saw your post. | Provided directly by LinkedIn Analytics. |
This table strips away the jargon and gives you the core formulas you need to start tracking what works.
By keeping a close eye on these social media engagement metrics, you can stop guessing and start making smart, data-driven decisions. Each number tells a part of the story, helping you fine-tune your strategy, create content that lands, and build a community that actually cares.
How to Calculate Your True LinkedIn Engagement Rate
Likes and comments are great, but the real story is in your engagement rate. Think of it as the ultimate health check for your content. It pulls all those different interactions into one powerful percentage, telling you not just if people engaged, but how many did, relative to the number of people who saw your post.
It’s the difference between knowing ten people clapped versus knowing that 50% of the room gave you a standing ovation. This single number is one of the most crucial social media engagement metrics you can track. It levels the playing field, letting you fairly compare a post that reached 1,000 people to one that hit 10,000. Without it, you're just chasing vanity metrics that don't tell the whole story.
Choosing the Right Formula for the Job
There’s more than one way to slice this. The best formula really depends on what you’re trying to figure out, as each one tells a slightly different tale about your content's performance.
Let's break down the three main formulas and when to pull each one out of your toolbox.
Engagement Rate by Reach (ERR): This is my go-to, and what I consider the most honest formula. It measures the percentage of unique people who chose to interact with your content after seeing it. Because it’s based on unique viewers, the metric isn’t thrown off if the same person sees your post five times.
Formula: (Total Engagements / Reach) x 100
Use it when: You want to know how well your content actually resonated with the people who saw it. It’s the perfect gauge for the quality and stickiness of your message.Engagement Rate by Impressions (ER Post): This one calculates engagement based on the total number of times your post was shown to anyone. Impressions are always higher than reach (one person seeing a post three times = three impressions), so this rate will naturally be lower than your ERR.
Formula: (Total Engagements / Impressions) x 100
Use it when: You’re running paid campaigns. Ad performance is almost always measured by impressions, so this helps you understand how effective your creative is each time it pops up in a feed.Engagement Rate by Followers (ER Followers): Here, you're measuring engagement against your total follower count. It's a bit of a blunt instrument for individual posts, since the algorithm definitely doesn't show your content to every single follower.
Formula: (Total Engagements / Total Followers) x 100
Use it when: You want a very broad, high-level benchmark of your account’s overall health over a long period, not the performance of a specific post.
For just about every content creator on LinkedIn, Engagement Rate by Reach (ERR) is the gold standard. It gives you the clearest, most actionable insight into how many people who actually saw your post thought it was worth their time.
LinkedIn Benchmarks: What Is a Good Engagement Rate?
Okay, so you have your number. What now? A metric without context is just data. Luckily, LinkedIn’s user base is famously active and engaged, especially compared to other platforms.
Recent data shows LinkedIn has a pretty impressive average engagement rate of 6.50%, blowing past what you’d typically see on a platform like Instagram. The trend is looking good, too, with the median rate climbing from 6.00% to 8.01% in just one year. This tells us that professionals on the platform are hungry for quality content.
Even niche B2B industries are crushing it. Agencies are hitting a 3.7% engagement rate and construction is at 4.0%, proving that specialized content really finds its home here. If you want to dive deeper into the numbers, Buffer.com has some great insights on these LinkedIn statistics.
As a simple rule of thumb for your own LinkedIn efforts, here’s a good way to read your results:
- Below 2%: Something’s not clicking. It’s probably time to go back to the drawing board and rethink your content strategy.
- 2% - 5%: You're in a great spot. This is a solid, healthy engagement rate that shows you're on the right track.
- Above 5%: Exceptional. You're clearly knocking it out of the park and providing massive value to your audience.
By using the right formula and stacking your results against these benchmarks, you can move past just counting likes and start truly understanding your content’s impact.
Turning Your Engagement Data Into a Winning Strategy
Looking at your social media engagement metrics in isolation is like trying to understand a road trip by looking at a single photo. Sure, that one picture of a great sunset is nice, but it doesn't tell you the whole story of where you've been or where you're headed.
The real magic happens when you start laying those photos out side-by-side. Suddenly, you see the journey. This is what you need to do with your data—transform those disconnected data points into a strategic roadmap for your content. It's how you shift from just being a content creator to becoming a data storyteller for your brand. By tracking metrics over time, you start to see powerful patterns that literally tell you what your audience wants more of.
Uncovering Powerful Content Trends
You don’t need some fancy, expensive software to start spotting trends. Honestly, a simple spreadsheet is all you need to get going.
Just create a few columns for your key metrics: Reach, Impressions, Likes, Comments, Shares, and Engagement Rate. Every time you publish a post, log the data. It's that simple.
After just a few weeks, you'll start to see things emerge from the noise. You can begin asking the kind of strategic questions that your data can actually answer:
- Content Format: Are my short video clips consistently getting more shares than my static images?
- Topic Clusters: Do my posts about personal productivity light up the comment section more than industry news updates?
- Posting Style: What happens to my engagement rate when I lead with a question?
Answering these questions is the key. It lets you double down on what’s clearly working and figure out what’s falling flat. This is the difference between throwing content at the wall to see what sticks and building a content engine that predictably gets results.
This handy visual shows how the foundational metrics—reach, impressions, and followers—all feed into the engagement you're trying to build.
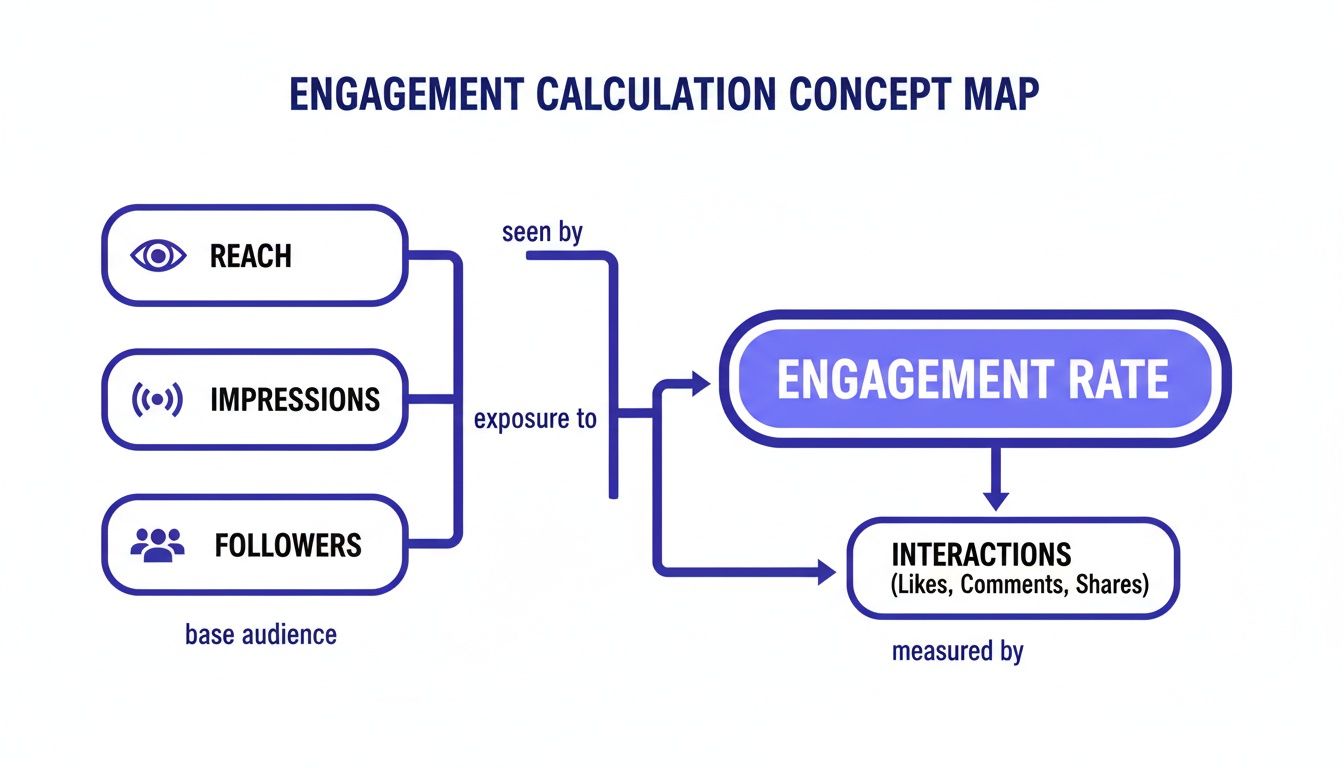
It’s a great reminder that just reaching people isn't enough; you have to give them a reason to actually interact.
Interpreting Positive and Negative Signals
Once you have the data, the next step is figuring out the "why" behind the numbers. This is where your intuition and experience come into play.
Positive Trends to Amplify
Let's say you notice a big spike in shares every time you post a carousel with a step-by-step guide. That's not a coincidence—it's a massive signal from your audience. They're telling you they find that format super valuable and worth sharing. The action here is obvious: make more step-by-step carousels.
Your most engaging content is a direct request from your audience for more of the same. Listening to these data-driven requests is the fastest way to build a loyal and active community.
Negative Trends to Correct
On the flip side, what if your text-only posts consistently get the lowest reach and engagement? That's also incredibly useful feedback. It might not mean the topic itself is bad, but the format just isn't grabbing attention in a visually crowded feed.
Your next move could be to test that exact same information but packaged as a simple graphic or a quick video. For a full breakdown of what to track, explore our guide on how to measure social media success.
This whole process turns your content strategy into a dynamic feedback loop. You post, you measure, you learn, and you refine. Each cycle sharpens your content and strengthens your audience connection. To really dig into turning these insights into business growth, check out these proven strategies for LinkedIn lead generation. This is how you build a winning strategy—one data-informed decision at a time.
Actionable Tactics to Increase Your LinkedIn Engagement
Alright, knowing your social media engagement metrics is one thing. Actually moving the needle on them is another game entirely. The goal isn't just to watch the numbers but to make them grow, and that takes a deliberate, tactical approach.
There's no magic bullet here. It's about consistently applying proven strategies that stop the scroll and turn passive viewers into an active, engaged community. Think of this as your playbook for sparking real conversations, building authority, and driving the interactions that actually matter for your business.
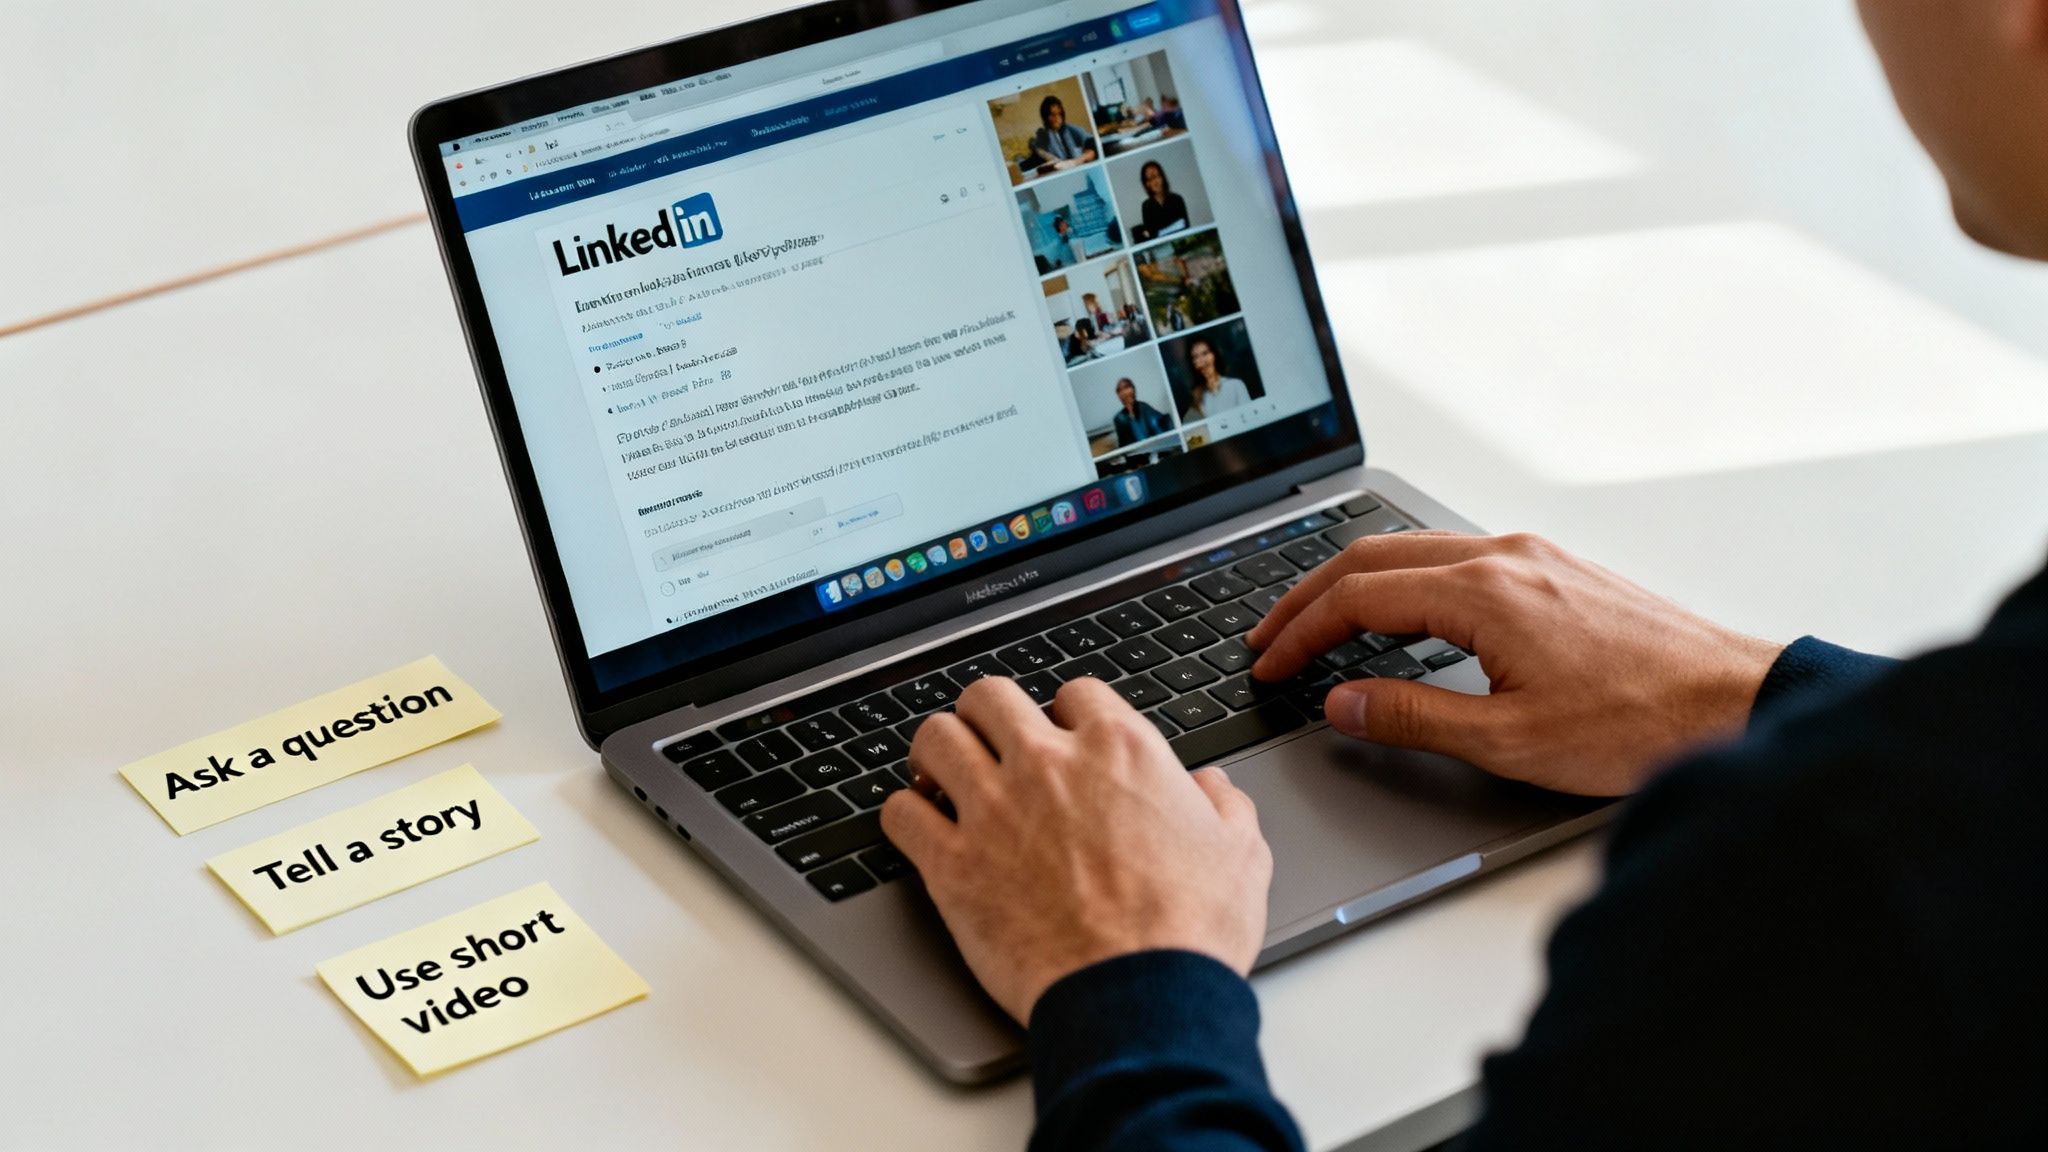
Spark Conversations with Compelling Questions
The easiest way to get a response? Just ask for one. But there's a catch—not just any question will work. Ditch the generic, "yes" or "no" questions that kill conversations before they start.
Instead, ask open-ended questions that invite people to share their own experiences, opinions, and stories. You're not just broadcasting anymore; you're starting a dialogue. It shows you genuinely value what your audience has to say and gives them an easy way to jump in.
Here's how to nail it:
- Lead with a personal story or insight to set the stage and build a little rapport.
- Finish with a clear, open-ended question that ties back to your story.
- Reply to every single comment. This shows you’re actually listening and encourages more people to participate.
For example: "I just spent an hour untangling a client's messy spreadsheet and it got me thinking... What's the one non-negotiable tool you use every day to stay organized?"
This does more than just rack up comments; it builds a community around shared professional headaches and triumphs. For a deeper dive, these 10 proven LinkedIn marketing strategies can help you get seen and build trust.
Create an Emotional Connection with Storytelling
Facts and figures inform, but stories connect. At the end of the day, professionals on LinkedIn are still people, and we all respond to narratives that feel human. Sharing your challenges, wins, and the lessons you learned along the way is an incredibly powerful way to build trust.
Think about a specific hurdle you overcame or a mistake that taught you something crucial. Frame it as a short story—a quick beginning, middle, and end. The goal is authenticity and relatability, not just broadcasting your highlight reel. If you need some inspiration, check out these LinkedIn post examples that have mastered the art of storytelling.
Leverage High-Impact Visual Formats
Let’s be honest, the LinkedIn feed is crowded. To stand out, you need to move beyond simple text posts. The algorithm and users alike have a clear preference for certain visual formats that grab and hold attention. The two heavy hitters right now? Multi-image carousels and native video.
Native video, uploaded directly to the platform, is an absolute powerhouse. It gets 38% more engagement and 42% better visibility than just dropping a YouTube link. The sweet spot is short-form content—clips under 60 seconds hold onto 87% of viewers and get 1.7x more engagement per second.
Pro-tip: Always add captions. It can lead to 32% longer watch times and 29% more interactions from people watching with the sound off.
While video is potent, don't sleep on carousels (uploaded as PDFs). They currently boast a massive average engagement rate of 6.6%, with standard documents right behind at 6.1%.
Here’s a quick-start guide:
- For Carousels: Fire up a tool like Canva and create 5-10 slides that break down a complex idea or tell a visual story. Save it as a PDF and upload it as a "document" on LinkedIn.
- For Native Video: Grab your phone and record a quick 30-60 second clip sharing a single, valuable tip. Look at the camera, keep it real, and add those captions.
By intentionally mixing these tactics into your content strategy, you can actively shape your social media engagement metrics. It’s all about being thoughtful—asking great questions, telling real stories, and picking formats that stop the scroll.
How to Streamline Your LinkedIn Growth
Let’s be honest: juggling content creation, scheduling, and tracking your social media engagement metrics can feel like a full-time gig. You’re bouncing between different tools, trying to connect the dots between your ideas and your results, and it’s creating a ton of friction. That complexity is exactly what slows you down, but a unified platform can turn that entire mess into a simple, repeatable workflow.
This is where tools like PostFlow come into play. They're built to cut through that noise. Instead of that dreaded blank-screen paralysis, you can use AI to turn a quick voice note or a half-baked idea into a polished LinkedIn post. The system is designed to help you craft content that actually performs well against the metrics that matter, like comments and shares.
Measure What Matters in One Place
The real magic happens when your content creation is tied directly to your analytics. Forget exporting CSVs and wrestling with spreadsheets. When you can see your performance right inside your workflow, you can instantly connect a specific post to its impact.
For example, a dashboard view like this gives you immediate, actionable feedback on what you’ve published.
You can see at a glance which posts are pulling in the most impressions and engagement. That means you can spot trends fast and start doubling down on the content your audience actually wants to see.
When your analytics are tied directly to your content calendar, you move from reactive measurement to proactive strategy. You’re no longer just reporting on the past; you’re using real-time data to make smarter decisions about your next post.
This kind of integrated approach builds a powerful feedback loop. You can test a new content format, see how it affects your engagement rate, and tweak your strategy—all without leaving the platform. It takes the guesswork out of the equation and helps you turn your professional expertise into real, measurable growth on LinkedIn. It's all about consistency and data-driven improvements, creating a momentum that builds on itself over time.
Your Top Engagement Metric Questions, Answered
Jumping into your analytics can feel like decoding a secret language. Let's clear up some of the most common questions professionals have when they start digging into their LinkedIn performance.
What Is a Good Engagement Rate on LinkedIn?
Everyone wants to know the magic number. While it shifts a bit depending on your industry, a "good" engagement rate on LinkedIn is generally anything north of 2%.
If you're hitting between 2% and 5%, you're doing great. Anything over 5% is top-tier stuff. But honestly, the best benchmark isn't some industry average—it's your own last post. Focus on beating your own numbers and creating that steady, upward trend.
Which Engagement Metric Is the Most Important?
This is a classic trick question. There’s no single "most important" metric, because the right one depends entirely on what you're trying to achieve.
- Want to get your name out there? Then you're all about Reach and Impressions.
- Trying to build a loyal community? You should be obsessed with Comments and Shares.
- Need a quick health check? The overall Engagement Rate gives you the best all-around snapshot of how your content is landing.
The most important metric is simply the one that proves you're getting closer to your goal. Chasing vanity numbers that don't align with your strategy is a waste of time.
How Often Should I Check My Engagement Metrics?
Finding the right rhythm is key. You don't want to become a slave to your dashboard, but you also can't afford to fly blind.
A quick weekly check-in is perfect for spotting what’s working right now and making small tweaks. For the bigger picture, block out time for a deeper dive on a monthly and quarterly basis. That's where you'll uncover the insights that shape your long-term content strategy.
Ready to stop guessing and start growing? PostFlow uses AI to help you create high-impact LinkedIn content and provides a simple dashboard to track the metrics that matter. Streamline your entire workflow at https://gopostflow.com.